Experiture’s AI Analytics Suite: The Way Omnichannel Reporting Should Feel
Reporting isn’t the finish line—it’s the starting gun. The new Experiture Analytics module turns email, landing pages/PURLs, calls, and SMS into one connected story that tells you what to change now, not next month.
The takeaway: less tab-hopping, more decision-making.
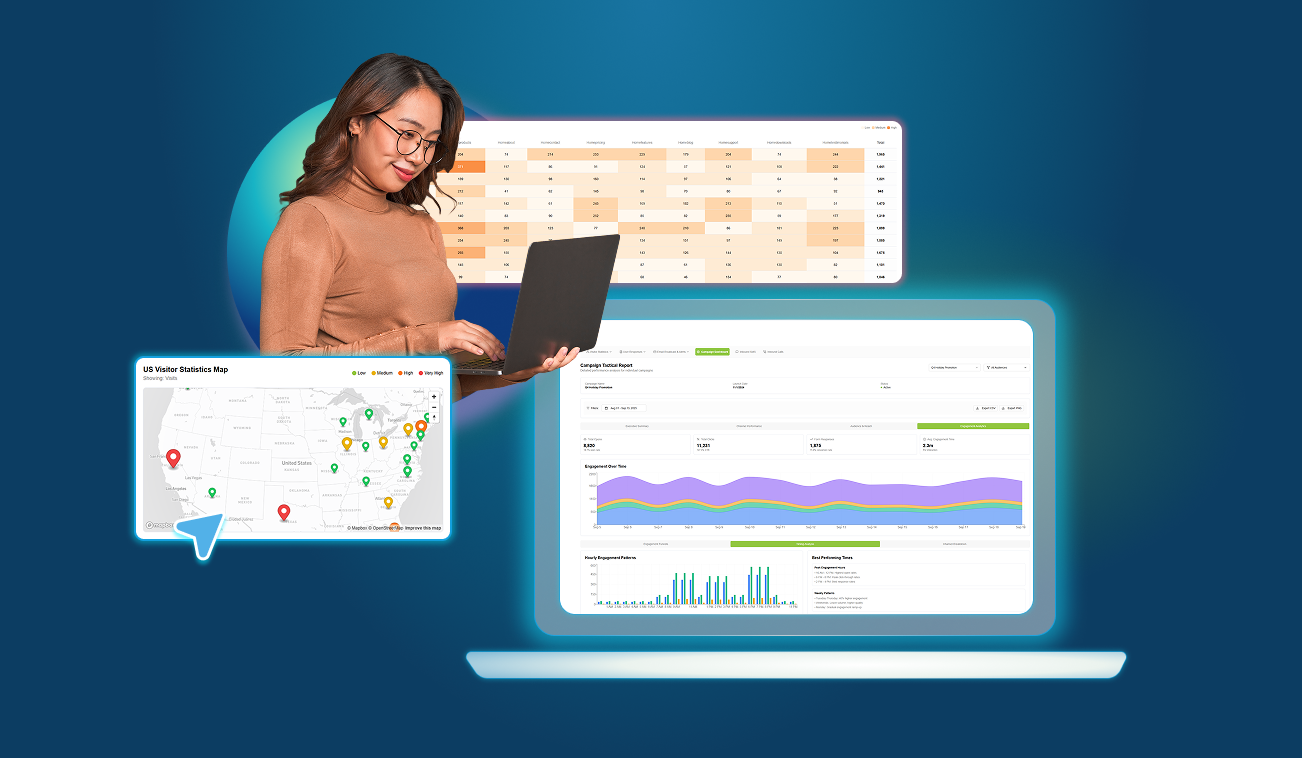
Campaign Dashboard: See the whole story, then act
You open a campaign. In one place you can read the room (reach, deliveries, engagement, conversions), compare channels, and see when your audience actually responds.
What you’ll see
- Executive Summary: Reach → Engagement → Conversions, plus overall conversion rate.
- Channel Performance: Side-by-side and efficiency ranking—what deserves the next dollar.
- Engagement Analytics:
- Timing Analysis (day/hour patterns).
- Funnels for Email/SMS/Push/Landing Page.
- Channel Breakdown over time.
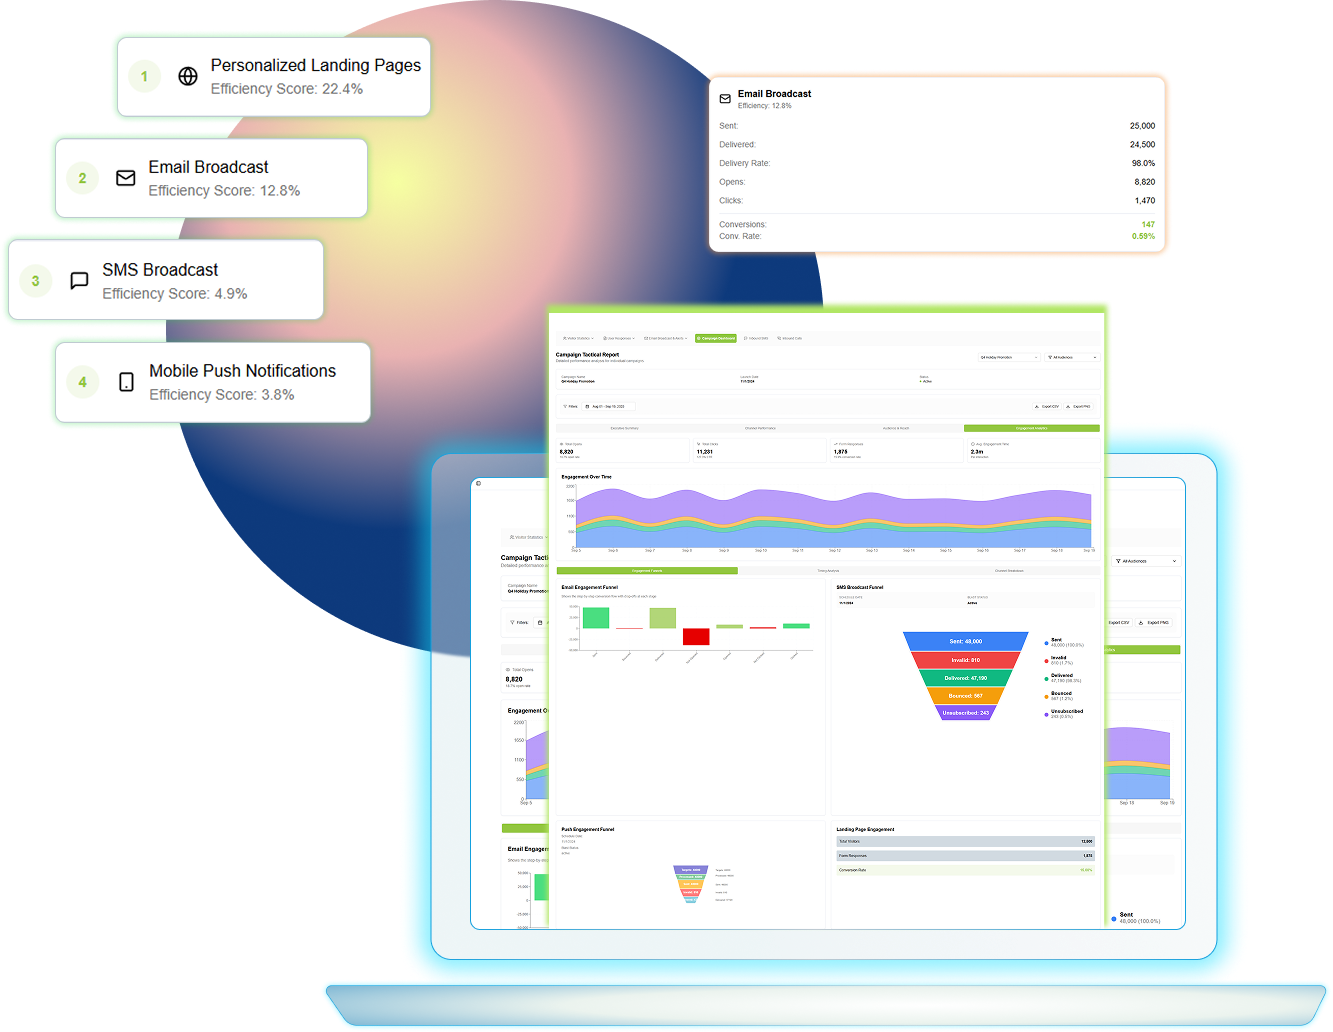
How to use it (fast)
- If conversions lag but engagement looks good → your leak is likely on the landing page (see Section 3).
- If one channel materially outperforms → reallocate today, not in the QBR.
- If response peaks at certain hours → shift sends and staff accordingly.
Consider this: a 60–90 minute send shift (from 9:30 to ~11:00) can lift opens and reduce reply lag—downstream call connections go up.
The takeaway: this is your daily command center. Read outcomes, move budget, adjust timing.
Email Reports: Fix Delivery When It’s Delivery, Fix Content When It’s Content
Email often lights the fuse. These views separate mechanics (can people receive it?) from motivation (do they care enough to act?).
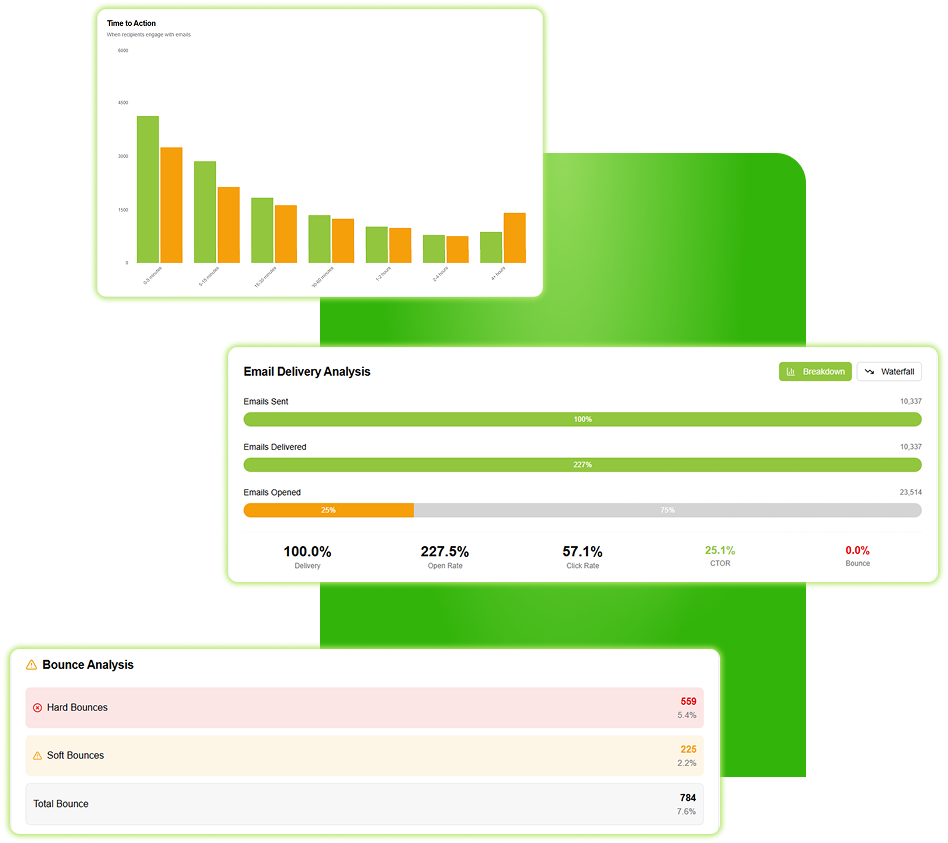
Use it to
- Spot divergence: if delivery holds but opens fall → test subject lines, segments, timing.
- Compare weekdays vs weekends; export the table for a quick revenue match back.
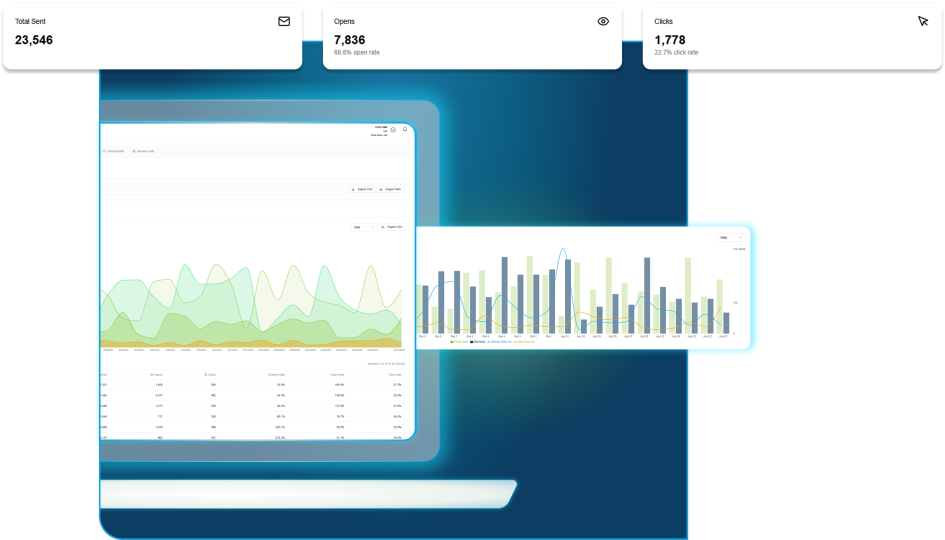
Delivery Performance (time range)
Bar/line composites for Sent, Delivered with Delivery Rate, Open Rate; a Detailed Analysis adds area trends and a daily table (delivery %, open %, click %).
Broadcast-level Diagnostics
Per-send Delivery, Open, Click, CTOR, Bounce Analysis (hard/soft), and Deliverability by Domain.
Use it to
- Catch ISP/corporate domain friction (apply throttling, warmups, content tweaks).
- “Open-good, click-weak” → tighten hero copy, clarify the offer, elevate the CTA.
Engagement Insights
Open Heatmap (day/hour), Time-to-Action, Top-Clicked Links.
Use it to
- Choose send windows from observed behavior, not hunches.
- Move consistently top-clicked modules above the fold on the landing page.
The takeaway: diagnose in the right order—delivery → timing → creative. Your fixes become obvious.
How It Aligns with Our Vision
We believe every user deserves speed and reliability. By ensuring faster, more dependable performance, we enable seamless, frustration-free experiences that let users focus on achieving their goals.
Landing Page Reports: PURLs, Patterns, & Where Your Buyers Are
Once the click happens, this is where you win or lose. Use PURL evidence, site-wide browsing, and geography to remove friction and amplify what’s working.
Delivery Performance (time range)
Bar/line composites for Sent, Delivered with Delivery Rate, Open Rate; a Detailed Analysis adds area trends and a daily table (delivery %, open %, click %).
PURL Visitor Reports (Overview, Trends, PURLs)
- Spot divergence: if delivery holds but opens fall → test subject lines, segments, timing.
- Compare weekdays vs weekends; export the table for a quick revenue match back.
- PURLs: For every personalized URL: Visits, Scans, Responses, Conversion Rate, Last Visited.
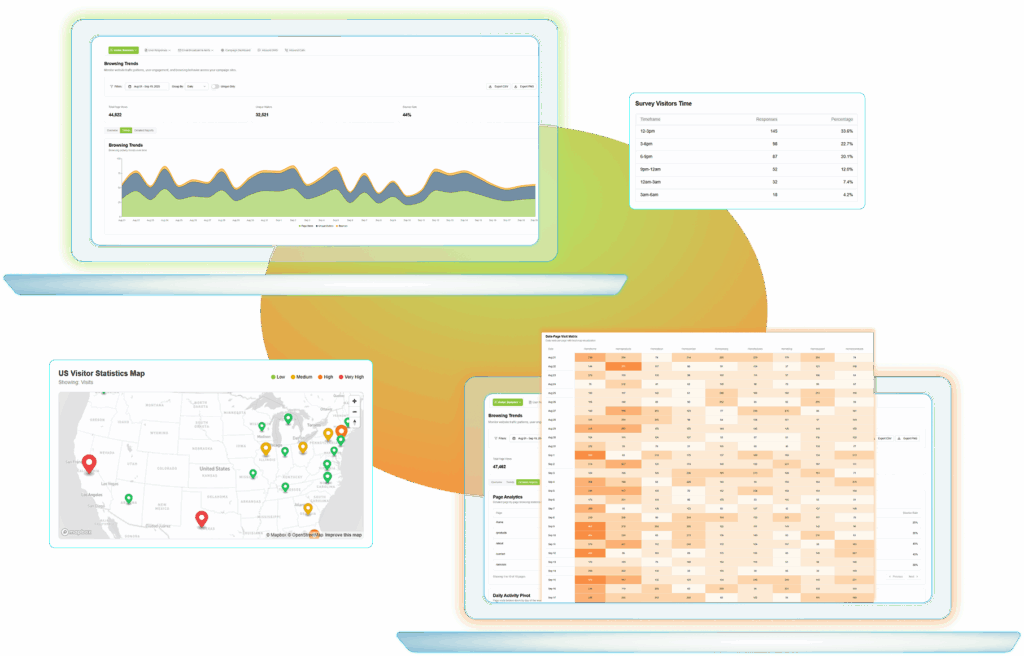
Do this
- High visits + low responses → shorten forms, reduce fields, sharpen the primary CTA.
- Many scans but few visits → fix QR placement/creative and micro-copy (“Scan to…”).
- Clone winners: reuse layout/offer from top-converting PURLs in your next wave.
Browsing Trends (site-wide)
Totals for Page Views, Unique Visitors, Bounce Rate; the Detailed Reports tab includes page analytics, a day-of-week pivot, and a date–page heatmap.
Do this
- Route paid/owned traffic to low-bounce, high-repeat pages.
- Fix “leaks” (high visits, high bounce) with faster load, tighter value prop, cleaner visual hierarchy.
Visitor Geography (map overlay)
US map + region pie + state table (Visits, Responses, Conversion Rate).
Do this
- Localize offers for hot regions; right-size media in low-yield areas
- Pair with PURLs to attribute offline triggers (mailers, events, signage).
The takeaway: treat landing pages like products. Measure, patch friction, clone what converts
Call Track Reports: Measure Conversions, Recover Missed Ones
When the goal is a conversation, you need visibility and speed.
What you’ll see
- Volume by day, Completed vs Missed, Average Duration.
- A detailed call record list with audio controls for QA.
Use it to
- Staff to reality: align agent coverage with peaks from Timing Analysis
- Save revenue: prioritize callbacks on missed calls within the next working block.
- Credit correctly: tie spikes back to specific emails/PURL waves to fund what truly works.
Browsing Trends (site-wide)
Consider this: if duration drops while volume climbs, listen to samples—agents might be rushing; small coaching fixes protect conversion.
The takeaway: treat landing pages like products. Measure, patch friction, clone what converts
Inbound SMS Reports Keep the Loop Clean and Fast
Two-way messaging turns interest into action—fast—when the plumbing works.
What you’ll see
- Totals plus a message log marked Delivered / Pending / Failed.
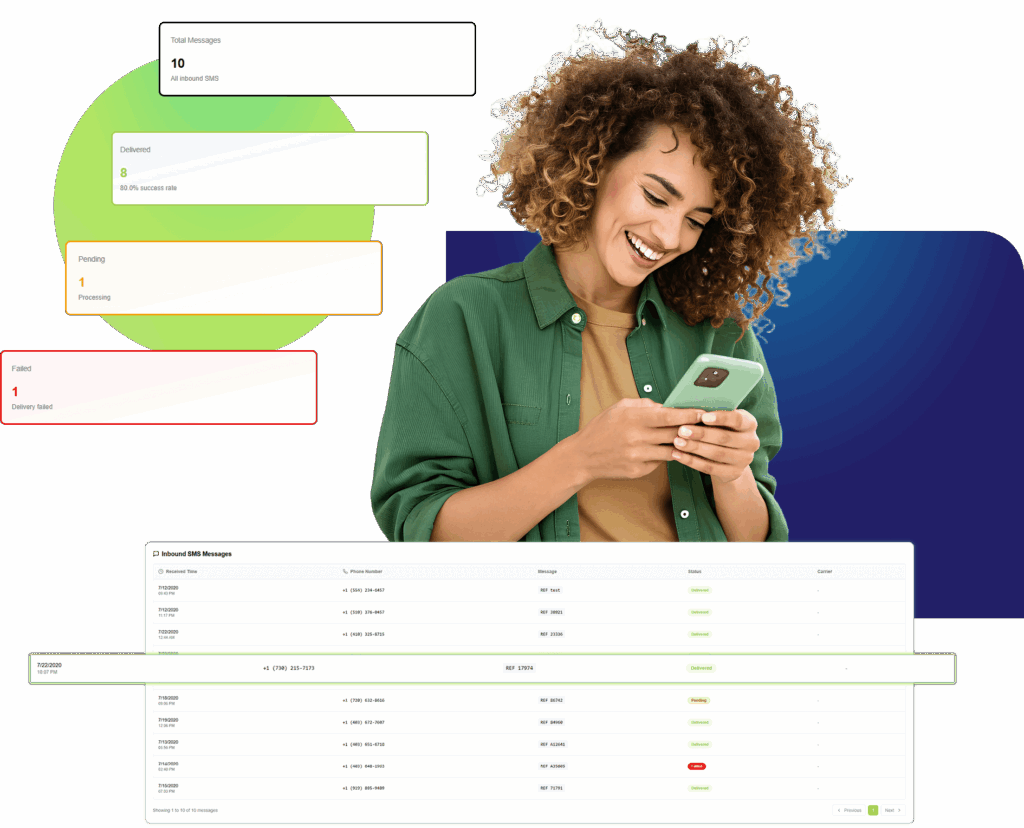
Use it to
- Verify shortcode/longcode health across carriers.
- Tune auto-replies and keyword handling (YES/STOP/HELP variants).
- Pair with Campaign Dashboard → Funnels to see where SMS accelerates—or stalls—the journey.
Consider this: a one-line auto-reply tweak (“You’re all set—tap to finish”) can move completion rates immediately.
The takeaway: tiny SMS fixes compound across campaigns.
A weekly rhythm that compounds
- Mon: Campaign Dashboard → reallocate volume/budget.
- Tue: Email → delivery & engagement fixes; retest subject/CTA.
- Wed: Landing Pages → PURLs + heatmaps; remove friction.
- Thu: Timing → shift send windows; staff calls.
- Fri: Calls & SMS → close loops; return missed; triage failures.
Most views export CSV/PNG—easy to share with finance, sales, and leadership.
Where AI fits (today → next)
- Best-time recommendations based on Timing Analysis + Email Heatmaps
- Deliverability guardrails that flag domain anomalies and prescribe hygiene/throttling.
- Journey fixes: opens but low CTOR + high bounce → suggest layout/copy tests on the landing page.
- Resourcing hints for call/SMS peaks so people are ready when attention arrives.
Your Takeaway
This isn’t “just reporting.” It’s a working surface for omnichannel marketing—clear, connected, and built to change outcomes while your campaign is still live.
Ready to Transform Your Marketing?
Discover the difference Experiture can make for your business. Schedule
a demo today to explore how our AI-powered platform can elevate
customer engagement, drive loyalty, and deliver measurable results.